Resource Monitor doesn't look right
Posted: 17 Jan 2025, 02:09
I am running resource monitor to help diagnose a sluggish system and am seeing odd behavior which I am hoping can be fixed or explained:
Cheers!
- Incorrect Values
I am not sure which value to believe, the resource monitor's CPU % value or the flyout dashboard's value. In the screenshot notice that the resource monitor is reporting > 30% yet the dashboard is claiming ~8%. Certainly both cannot be right.
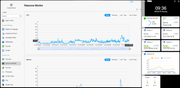
Memory values appear to be good and consistent. - Resource Monitor Graph Refresh
The graphs refresh themselves approximately every 2 seconds. When this happens the graph is cleared and redrawn from left to right. This means I only have 2 seconds to properly hover over a particular point to read the values in the popup window. It is absolutely frustrating trying to position over the right point only to have it clear and redraw.
It would be better to either not redraw while you are hovering. Or at least don't clear and redraw, rather shift the graph to the left so I can easily follow the target point as it moves. - Time Scope Resets with Graph Redraw
Super annoying. I love that I can zoom in to make it easier to identify specific points in the graph by changing the time scope slider below the graph. But every 2 seconds it redraws and that resets the time scope slider. Please retain the setting across graph refreshes otherwise, seriously, what is the point of having the scoping slider?
Same issue with the Load graph: I love that I can select/deselect the different time graphs (1 min, 5 min, 15 min). But that selection resets every 2 seconds. At least the chart doesn't clear itself like the others, but my selections are not persisted across redraws. - Question: What Are The Load Graph Lines?
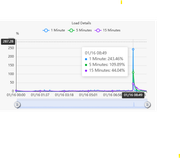
Silly question but in the Load chart what, exactly, does the 1, 5, 15 minute graphs mean? I assume they are moving averages over those time periods. Can you kindly confirm this? - Some Chart's Y Axis Units Are Questionable
In this chart screenshot, is the 1 minute average load really nearly 250% and 5 minute average load really > 100%? How is that possible?
- Network IO Label Confusion
I am not really clear on what Upstream vs Downstream refers to. I have to assume Upstream is network egress (or outgoing; data moving out of the NAS to the network) and that Downstream is network ingress (or incoming; data moving into the NAS from the network). Is that correct? The choice of Upstream/Downstream terminology suggests workflow as in: the NAS is downstream from my switch therefore network traffic coming from the network switch to the NAS is seen as "Downstream". Or is it that devices downloading files from the NAS are "downstream"?
I can obviously do experiments to determine this but I am recommending changing labels will make it more clear.
Cheers!
